| .. | ||
| src | ||
| Cargo.toml | ||
| README.md | ||
iced_profiling
[![]() ]
]


iced_profiling is a crate which implements various tracing backends for Iced.
It relies on the tracing crate to collect diagnostics. We currently only support
tracing with tracing's info_span! macro, but will consider different logging levels in the future. PRs welcome!
Trace backends
We currently support only Chrome JSON traces using the tracing-chrome crate.
There are plans to add support for Tracy in the near future!
Generating a trace file
Using Iced's Application
Simply enable your tracing backend of choice (e.g. trace_chrome) feature in Iced & run your project.
cargo run --features iced/trace_chrome
Standalone dependency
You can enable tracing by enabling your tracing backend of choice as a feature of iced_profiling.
iced_profiling = { version = "0.1.0", features = ["tracing-chrome"]}
Doing so will require you to initialize the profiler manually like so:
let _guard = iced_profiling::init();
This reference must be kept alive for the entire duration of your application that you wish to profile.
Chrome
By default, Chrome trace files will be generated in the current working directory:
path/to/your/project/project_trace_{timestamp}.json
You also set a specific path by setting the CHROME_TRACE_FILE env variable:
CHROME_TRACE_FILE = ~/Desktop/trace.json cargo run
If you cannot find your trace file, there may have been a permission issue when trying to generate your file. Be sure to check your cargo manifest directory!
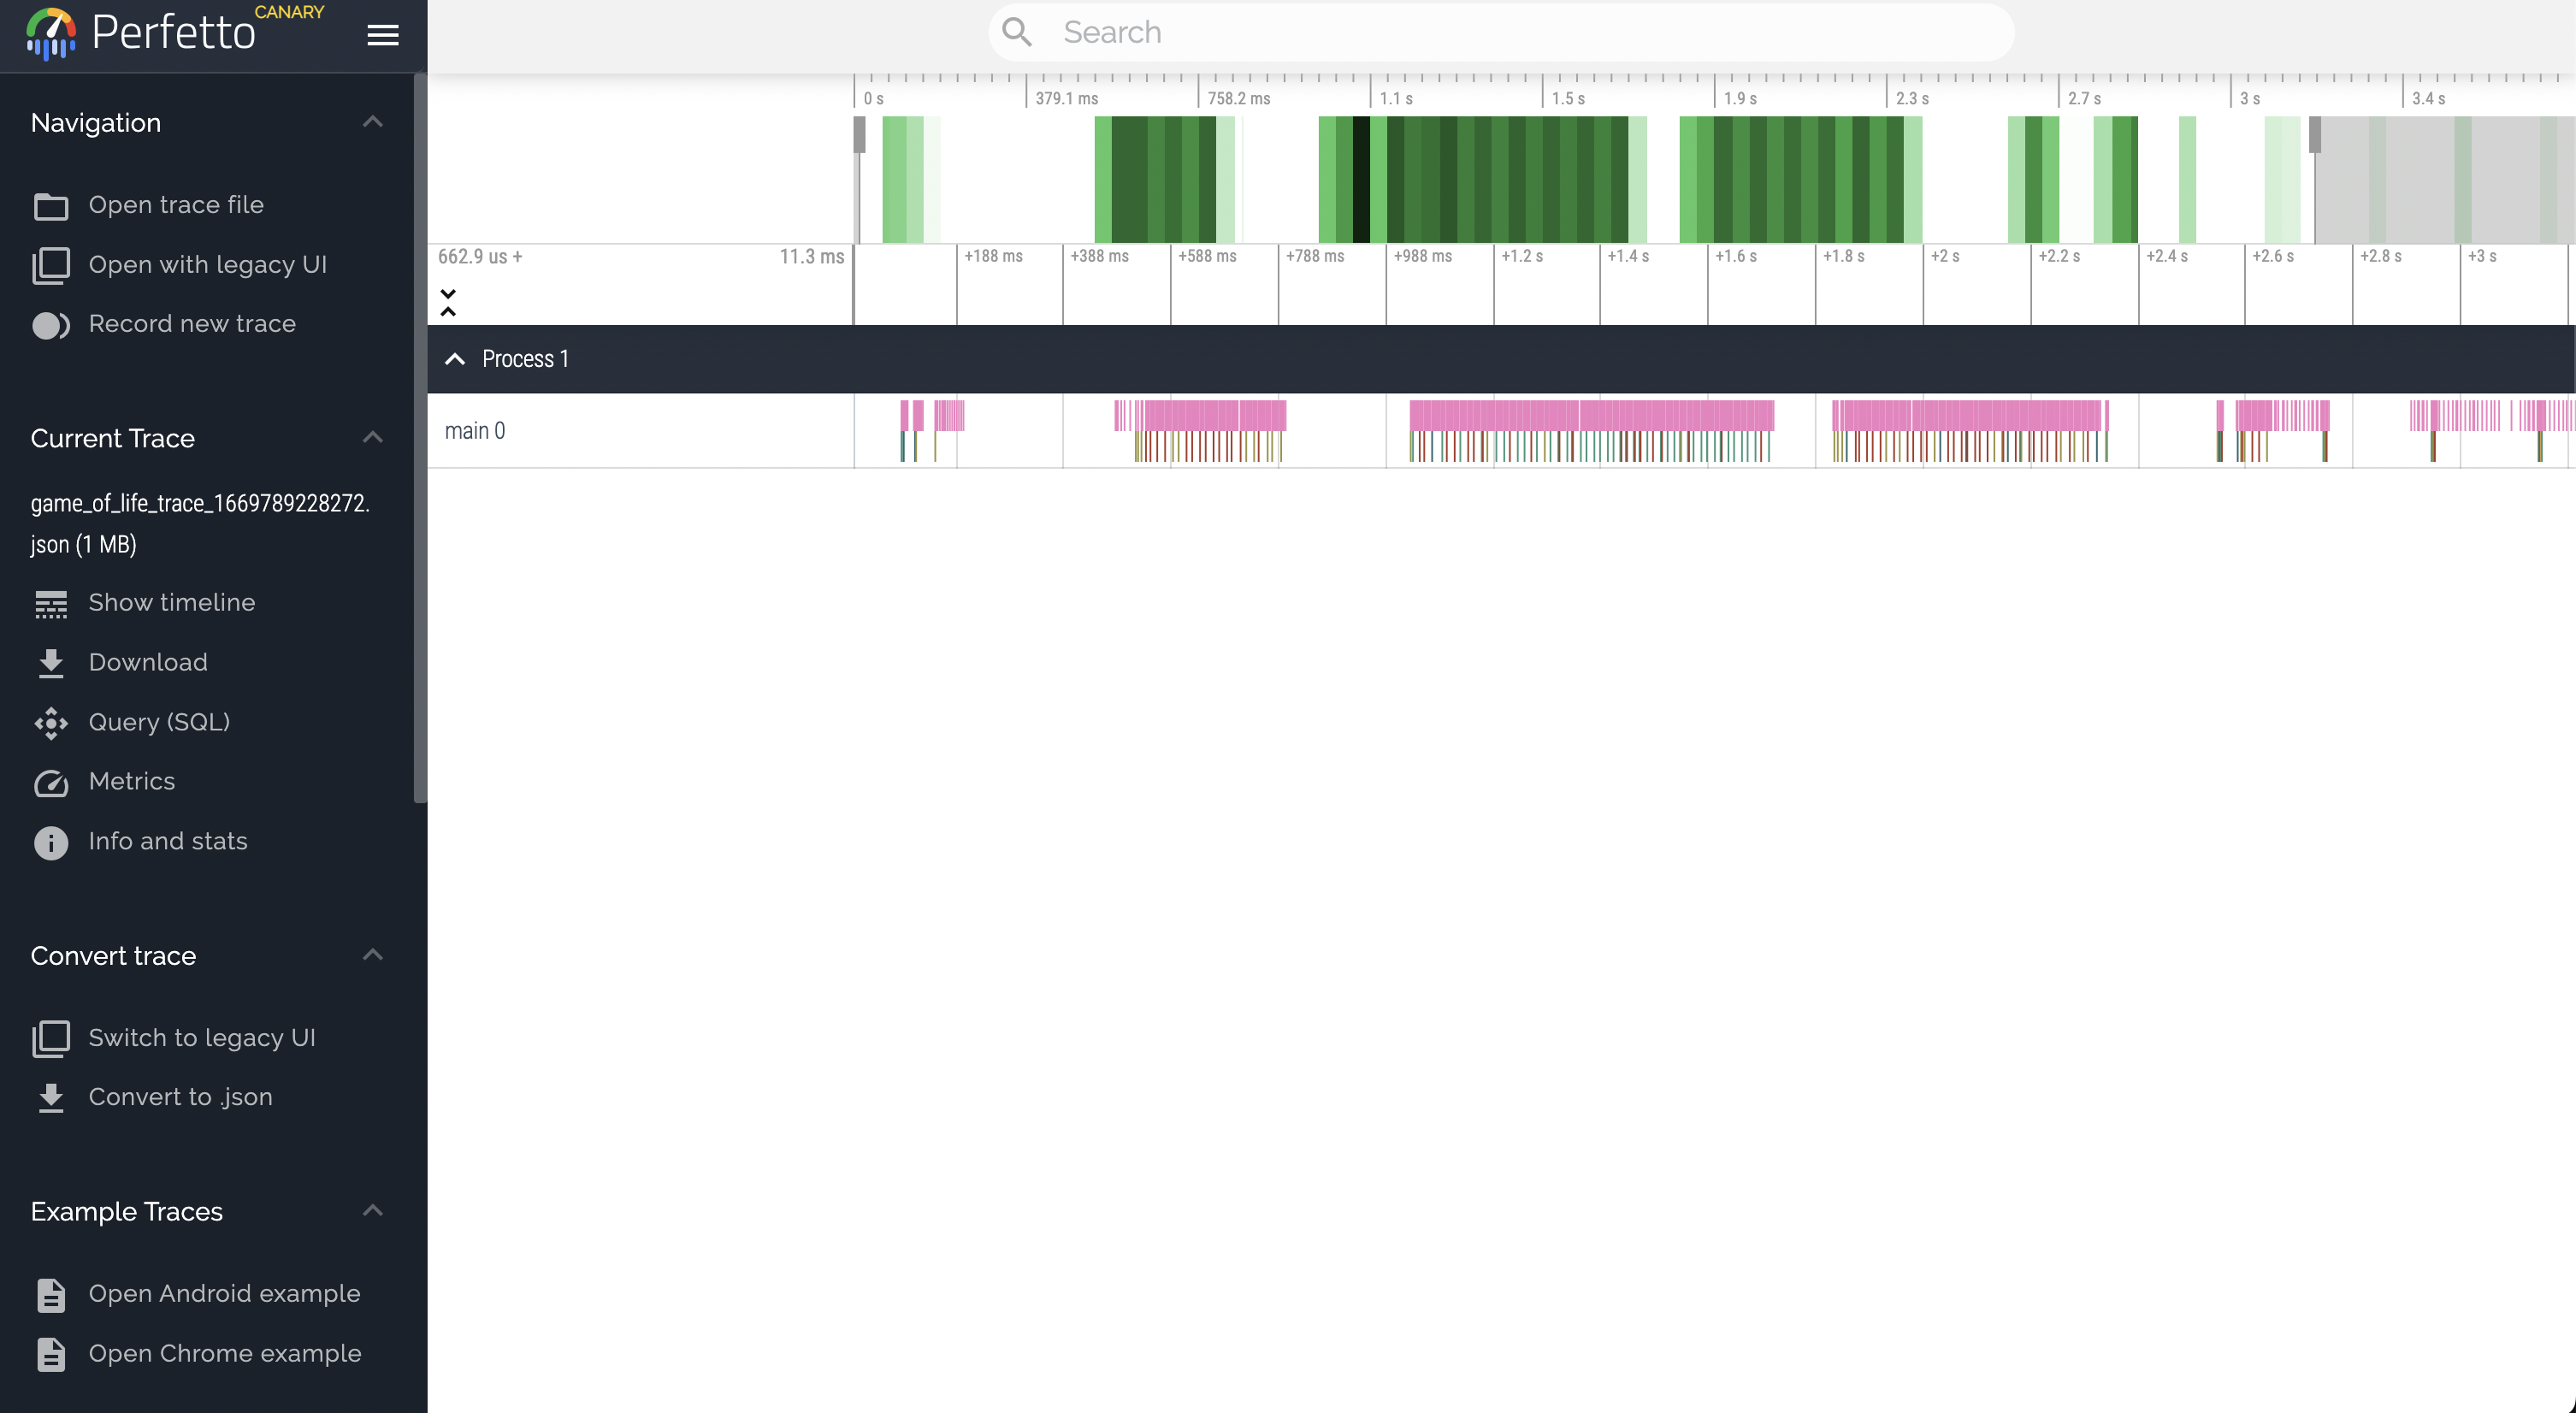
Once your file is generated, you can view it in Google Chrome at either ui.perfetto.dev (new) or chrome://trace (old).